Showing posts with label entomology. Show all posts

Monday, January 3, 2022

Art of the Insect Collection

As part of the recent exhibition "In Collaboration with Earth" at the Glass Box Gallery (UC Santa Barbara),  I presented a series of museum specimens with related artifacts. The first drawer of insects is all regional bees to Santa Barbara, California. The second drawer focuses on the Western Monarch. Discussion and Microtheater about the insect boxes were performed live during the exhibition and can be revisited on Facebook. In short, the insects are the stars!


Friday, November 5, 2021

Extending Anthophila research through image and trait digitization (Big-Bee)

 I am pleased to announce a new collaborative project called Big-Bee for the exploration of bee natural history traits via images and morphology. This three-year National Science Foundation funded project is a collaborative effort across thirteen US institutions and we will be digitizing bees from all over the world. Love bees, keep an eye on this project to see many lovely images. 

Big-Bee is also supporting a few new arts research projects, including a radio series called The Buzz, inspiring new Irene Moon performances and video collaborations.  Please keep in touch and find out more via the Big-Bee website at http://big-bee.net/. Buzz to you!


Monday, July 19, 2021

Irene Moon performs at The Museum of Contemporary Art Santa Barbara July 23, 2021

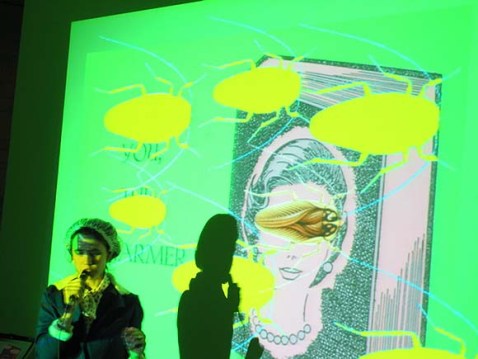
Irene Moon is performing during the closing reception for an exhibition by Shana Moulton at The Museum of Contemporary Art Santa Barbara. Shana Moulton will be performing The Invisible Seventh is the Mystic Column and Irene will present Lovely Moth, a new lecture about moths and your best behavior.

Both performances will also be broadcast via INSTAGRAM LIVE @mcasantabarbara starting at 5:15 pm. Starting at 6:00 will be a public closing reception. Please come join us at the Museum of Contemporary Art Santa Barbara patio.

Friday, April 30, 2021

zoom_zzee2 Microtheater video collaboration with Lovid

zoom_zzee2 Microtheater


zoom_zee2 is a video collaboration performed over Instagram with the analog video magicians Lovid. The performance includes a live micro theater (microtheater) of native bees of California and some discussion about the bee's anatomy and distributions. This microtheater also includes a little music to go along with the show and is part of the Begonia Society exploration in tracking species during climate change. If we know what species are around us perhaps we will know when they are missing?

Monday, August 19, 2019

Media Arts and Entomology

Notes from Nature article about Scientifically Speaking with Irene Moon was published in promotion of the upcoming WeDigBio museum curation events.  This is a reposting of that original article.

Irene Moon and NFN

The University of California Santa Barbara Cheadle Center for Biodiversity and Ecological Restoration Director has an alter ego. She goes by the name Irene Moon, and she came into being decades ago when Katja Seltmann first started creating science-inspired performance art. Some of the performances are artier, but many of them are specifically created to Perform Science!
This intersection of science and art opens up interesting ways to communicate about natural history collections and science in popular culture. Seltmann and her partner, Yon Visell, have a weekly radio show called “Unknown Territories”, a hour-long cultural arts program on the UCSB campus radio station, KCSB 91.9fm. The show airs on Monday 9-1000am PT and streams online at kcsb.org.
265154293_640

Several of her recordings of science inspired radio shows are available online. You can listen to interviews with researchers about various topics including rust, evolution and field recordings through the Let’s Talk Scienceseries. Recent shows are archived through the Internet Archive and found on the Unknown Territories website. Just like with the collection data she puts online, all of these recordings are all released under Creative Common licenses for reuse, or put into the Public Domain.
Natural history collections work has inspired much of the music, and Irene has several pieces for radio that are specifically about natural history collections. “Curator Bill” is a fictional character that appears throughout the radio pieces, and the audio introduction to Bill.
irene_moon

So next time you need perk up a boring lecture for that intro bio class, think about singing songs in a gold jacket, or create music about the topic. She has performed absurd Scientifically Speaking with Irene Moon musical lectures where collections are highlighted as the character of one of her personal heroes, EO Wilson. “Most of the lectures are done in late night musical venues, rock clubs, and raves. The information is factual, inspired by research, and people do learn when they least expect it.”
Find out more at begoniasociety.org
Check out some of her performances at the links below.

Monday, April 6, 2015

Beautifully Uninformative

Part of my scientific research is to evaluate and visualize large biodiversity datasets around a type of insect commonly known as Plant Bugs (Miridae). The dataset is big, comprising of around 1.5 million specimen records from Natural History collections (tcn.amnh.org).

These visualizations can easily take on a life of their own leaving their descriptive and scientific nature behind, transforming into objects of beauty and disinformation rather than clarification. The illustrations are not random nor imaginative as each of them is powered by the same dataset of Plant Bugs - where the insects were collected, their food plants, and dates of that collection event. These simply exist as an alternative representation of a highly complex natural ecosystem as we have recorded and translated into discrete pieces of information.

Histogram 1 & 2: Collecting event based on plant family with
mixed up columns and rows.


Histogram 3: Plant diversity for every
insect species. The graph is so dense many of the 
columns just appear black.
Network graphs are some of the most striking on the Web and found in publication. Outside of demonstrating that a network is complex, it is very difficult to make them visually informative but fairly easy to make them striking. This is demonstrated with Host Network Graph 1, which is the product of using only the defaults of the R igraph package.

Host Network Graph 1: Default color scheme with all nodes arranged circularly. Only a few of the most numerous edges are visible. 

Art remains interrelated with the possibility of scientific discovery or description since the dataset originates from actual ecosystem observation. Highlights of information can be found in graphs simply made for visual pleasure. The two network graphs below are an example of graphs that convey some truth about Plant Bugs and the way they function in complex ecosystems. In Host Network Graph 2, the plants that the bugs eat tend to be the nodes that have several edges coming from them like fireworks scattering. Reminiscent of constellations, the pattern indicates that many plant bugs are fairly plant food specific. In other words, plant bugs are very selective about what they eat, leading toward isolated groupings of nodes and edges.

In Host Network Graph 3, green nodes are plants eaten by Plant Bugs. The large green circle indicates that more plant bugs like to eat this plant than any other. This network graph, with its giant green node, makes it clear that plant bugs like to eat pine trees.

Host Network Graph 2: Insect and plant interaction are rather isolated.
Host Network Graph 3: A host plant network for Plant Bugs with one favorite plant.